Solutions

DSQ Discovery


DSQ Discovery

Learn about DSQ Discovery


Features

Explore its powerful tools


Pricing

Choose the right plan


Case Studies

See real-world insights

DSQ Pioneer


DSQ Pioneer

Learn about DSQ Pioneer


Features

Explore its powerful tools


Pricing

Choose the right plan


Case Studies

See real-world insights

DSQ Hauler


DSQ Hauler

Learn about DSQ Hauler


Features

Explore its powerful tools


Pricing

Choose the right plan


Case Studies

See real-world insights

DSQ Tilt


Professional Services

About Professional Services


Offerings

Explore our services


Pricing

Connect to discuss


Case Studies

See real-world insights


DSQ Tilt

Learn About DSQ Tilt

See DSQ Case Studies

Resources

How We Compare

See how our solutions stack up.


DSQ Blog

Insights, updates, and industry-related articles.


Help Center & Docs

Find answers and get customer support.
Technical guides and API documentation reference.


Help Center & Docs

Technical guides and API documentation reference.


Release Notes & Changelog

Latest updates, fixes, and new features.

Company

About DSQ

Discover who we are.


Our Story

Learn about our journey.


Meet The Founders

Get to know our leaders.

Page Three

Lorem ipsum dolor sit amet consectetur elit

Page Four

Lorem ipsum dolor sit amet consectetur elit

Company
Link FiveLink SixLink Seven
Link OneLink TwoLink Three
Let's Talk Trash!
Solutions

DSQ Discovery


DSQ Discovery

Learn about DSQ Discovery


Features

Explore its powerful tools


Pricing

Choose the right plan


Case Studies

See real-world insights

DSQ Pioneer


DSQ Pioneer

Learn about DSQ Pioneer


Features

Explore its powerful tools


Pricing

Choose the right plan


Case Studies

See real-world insights

DSQ Hauler


DSQ Hauler

Learn about DSQ Hauler


Features

Explore its powerful tools


Pricing

Choose the right plan


Case Studies

See real-world insights

DSQ Tilt


Professional Services

About Professional Services


Offerings

Explore our services


Pricing

Connect to discuss


Case Studies

See real-world insights


DSQ Tilt

Learn About DSQ Tilt

See DSQ Case Studies

Resources

How We Compare

See how our solutions stack up.


DSQ Blog

Insights, updates, and industry-related articles.


Help Center & Docs

Find answers and get customer support. Technical guides and API documentation reference.


Docs

Technical guides and API documentation reference.


Release Notes & Changelog

Latest updates, fixes, and new features.

Company

About DSQ

Discover who we are.


Our Story

The journey, vision, and mission behind us.


Meet The Founders

The minds behind our innovation and success.

Page Four

Lorem ipsum dolor sit amet consectetur elit

Company
Link FiveLink SixLink Seven
Let's Talk Trash

How Discovery Increases Brokerage Profitability by Up to 35%

Discovery’s Gross Margin Report eliminates manual calculations to identify unprofitable or low-margin locations to increase gross margins easily.

DSQ Case Studies
DSQ Discovery
How Discovery Increases Brokerage Profitability by Up to 35%
Published on
June 20, 2025
The Results
No items found.

It’s insanely hard for waste brokerages to measure gross profits at a granular level, if they are using manual tools or inferior software. Tracking gross margin on a per-container basis across a customer portfolio can mean the difference between thriving or slowly dying.

Calculating these granular insights without the proper tools is frustrating. All businesses keep track of their costs and revenues, but brokerages, which have two transactions for every interaction, have to align every line item billed from a Hauler to the correct line item invoiced to a Customer. That exercise might span two or more systems, with Excel acting as some sort of manual duct tape and bubble gum method to get you quick-and-dirty data before the process starts all over again for next month.

Discovery Customers access verified and auditable gross-margin data immediately and can make adjustments faster than their competitors.  They use that advantage to increase their gross margins by up to 7 percentage points, which directly flows to the bottom line.

The Brokerage Challenge

Every waste brokerage owner and executive understand that their customer portfolio is the cornerstone of their brokerage’s success. Yet it is often difficult for brokerages to quickly and easily access their customer portfolio’s most important metrics like gross margin.  

‍

Without these customer profile metrics, a brokerage lacks a clear view of profitability to make informed decisions. This can lead to misallocating resources, investing in locations that may need elimination, and missing cost-saving opportunities.  

Discovery’s Gross Margin Report

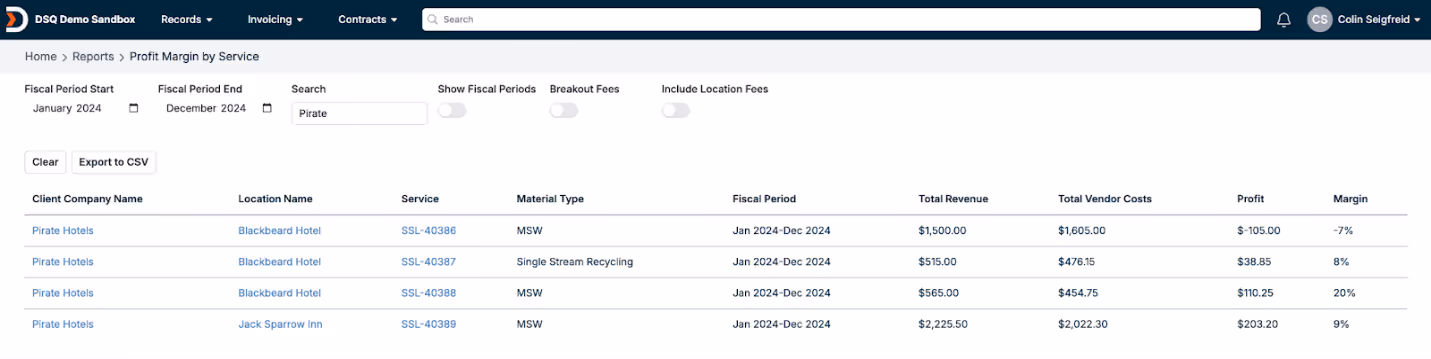
Discovery’s Gross Margin Report feature auto-generates accurate gross margins for a waste brokerage’s locations. Instead of exporting accounting data into Excel and manually calculating these numbers by matching revenue and payables associated with each client, Discovery users waste invoice data is automatically matched and available at any time. Discovery does the hard work of matching payables line-items from a waste hauler to revenue line-items sent to your customer – including unexpected charges like Excess/Overage and Contamination, roll offs, bulk pickups, and ongoing scheduled services.

‍

An example of Discovery’s Gross Margin Report

‍

Understanding Your Customer Profile

There are three ways the Discovery customer understands its customer profile and activates improvements using the Gross Margin Report:

  1. Identify and eliminate unprofitable locations  
  1. Identify and eliminate low gross margin locations
  1. Identify and improve low gross margin locations

‍

Identify Unprofitable Locations

The Gross Margin Report easily shows which of a brokerage’s locations are unprofitable. For the ADRC, that equates to about three locations within its customer profile.

By eliminating these unprofitable locations, the ADRC sees a direct increase in its gross margin by 1.12 percentage points.

Identify Low Gross Margin Locations

Discovery’s Gross Margin Report can also identify low gross margin locations. Low gross margin locations consume capital that can be funneled to more profitable locations for a stronger impact. The Average Discovery Revenue Customer finds that 12 locations produce a low gross margin of less than 20%.

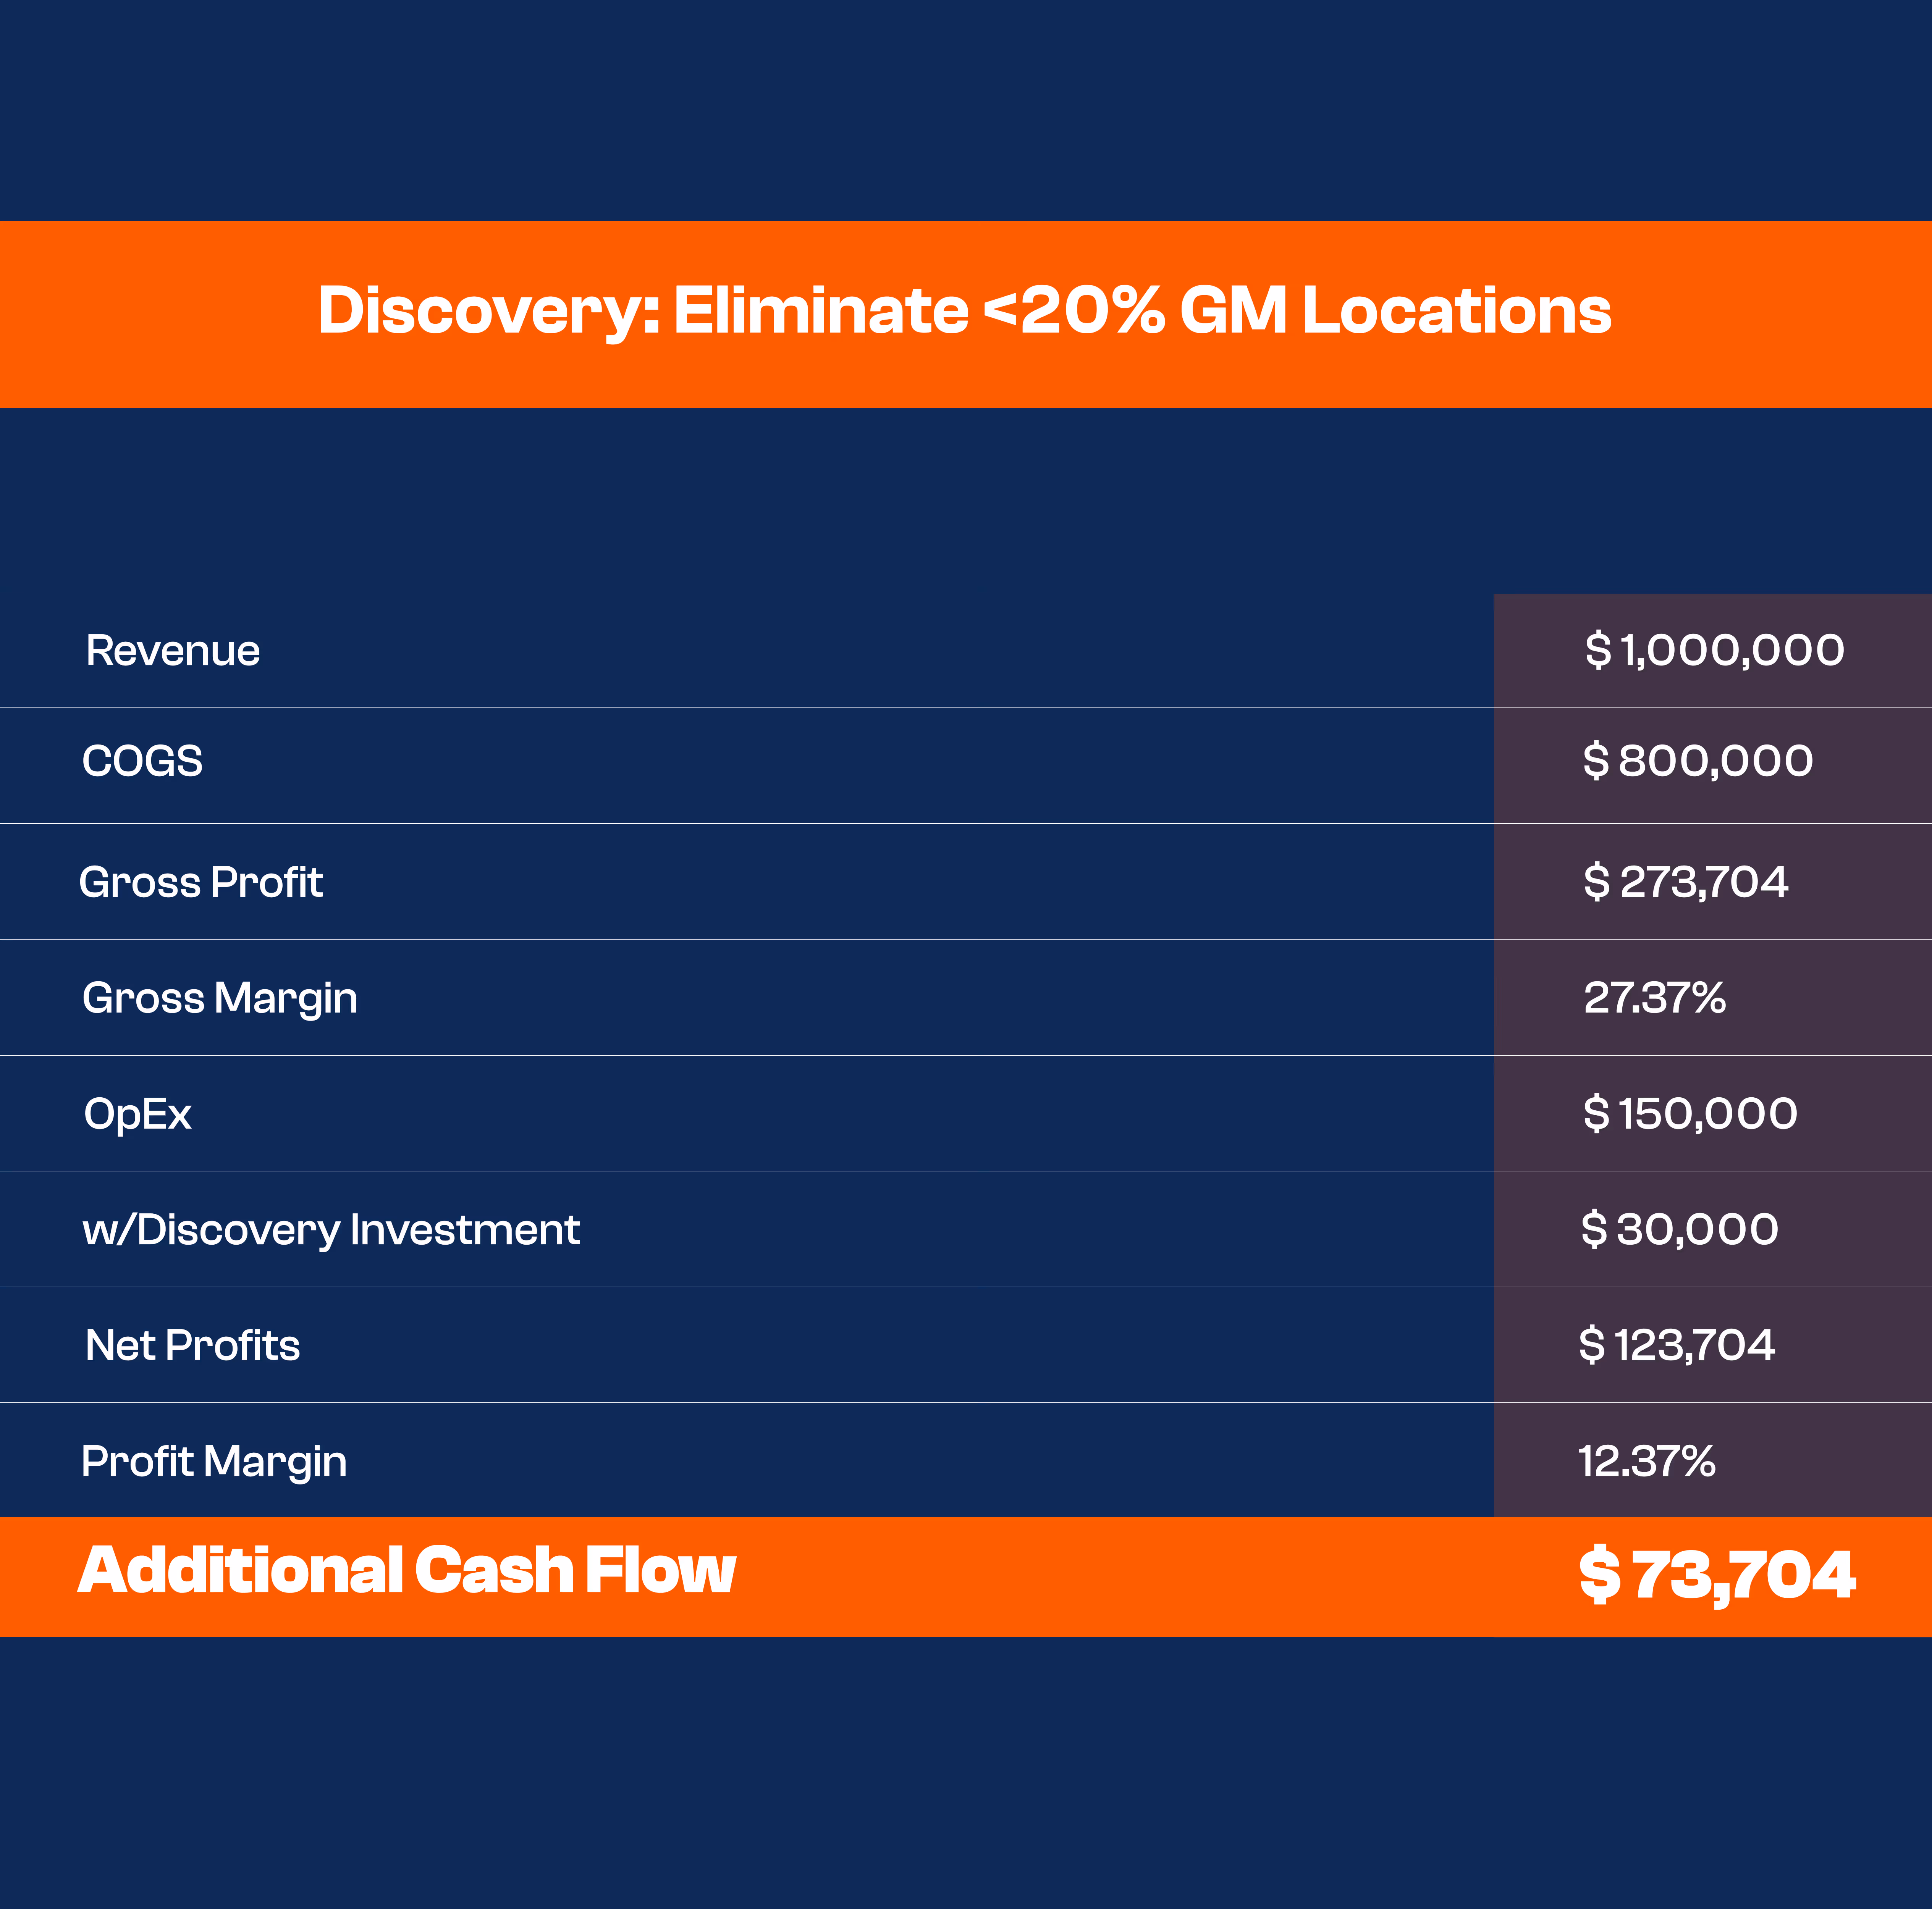
With this knowledge, a brokerage can eliminate those 12 locations from its portfolio. For the ADRC, that equates to a 7.37 percentage point increase in gross margin. With this percentage point increase from 20% to 27.37%, the average customer sees a 35% increase in profitability.

Alternatively, a brokerage could also focus on improving these locations. By increasing these locations’ gross margins by 10 percentage points, our data shows the average brokerage would see a 3.74 percentage point bump in its gross margin.

The Profitability Impact

Discovery’s Gross Margin Reports enable gross margin improvements, which leads to more profitability. For every 1% increase in gross margin, a brokerage experiences a disproportionately larger increase in profitability.

For the ARDC with $1 million annual revenue, that equates to ~$73,000 in additional profit when eliminating low gross margin locations.

‍

An illustration of the Average Discovery Revenue Customer’s Cash Flow impact by eliminating locations with <20% gross margin

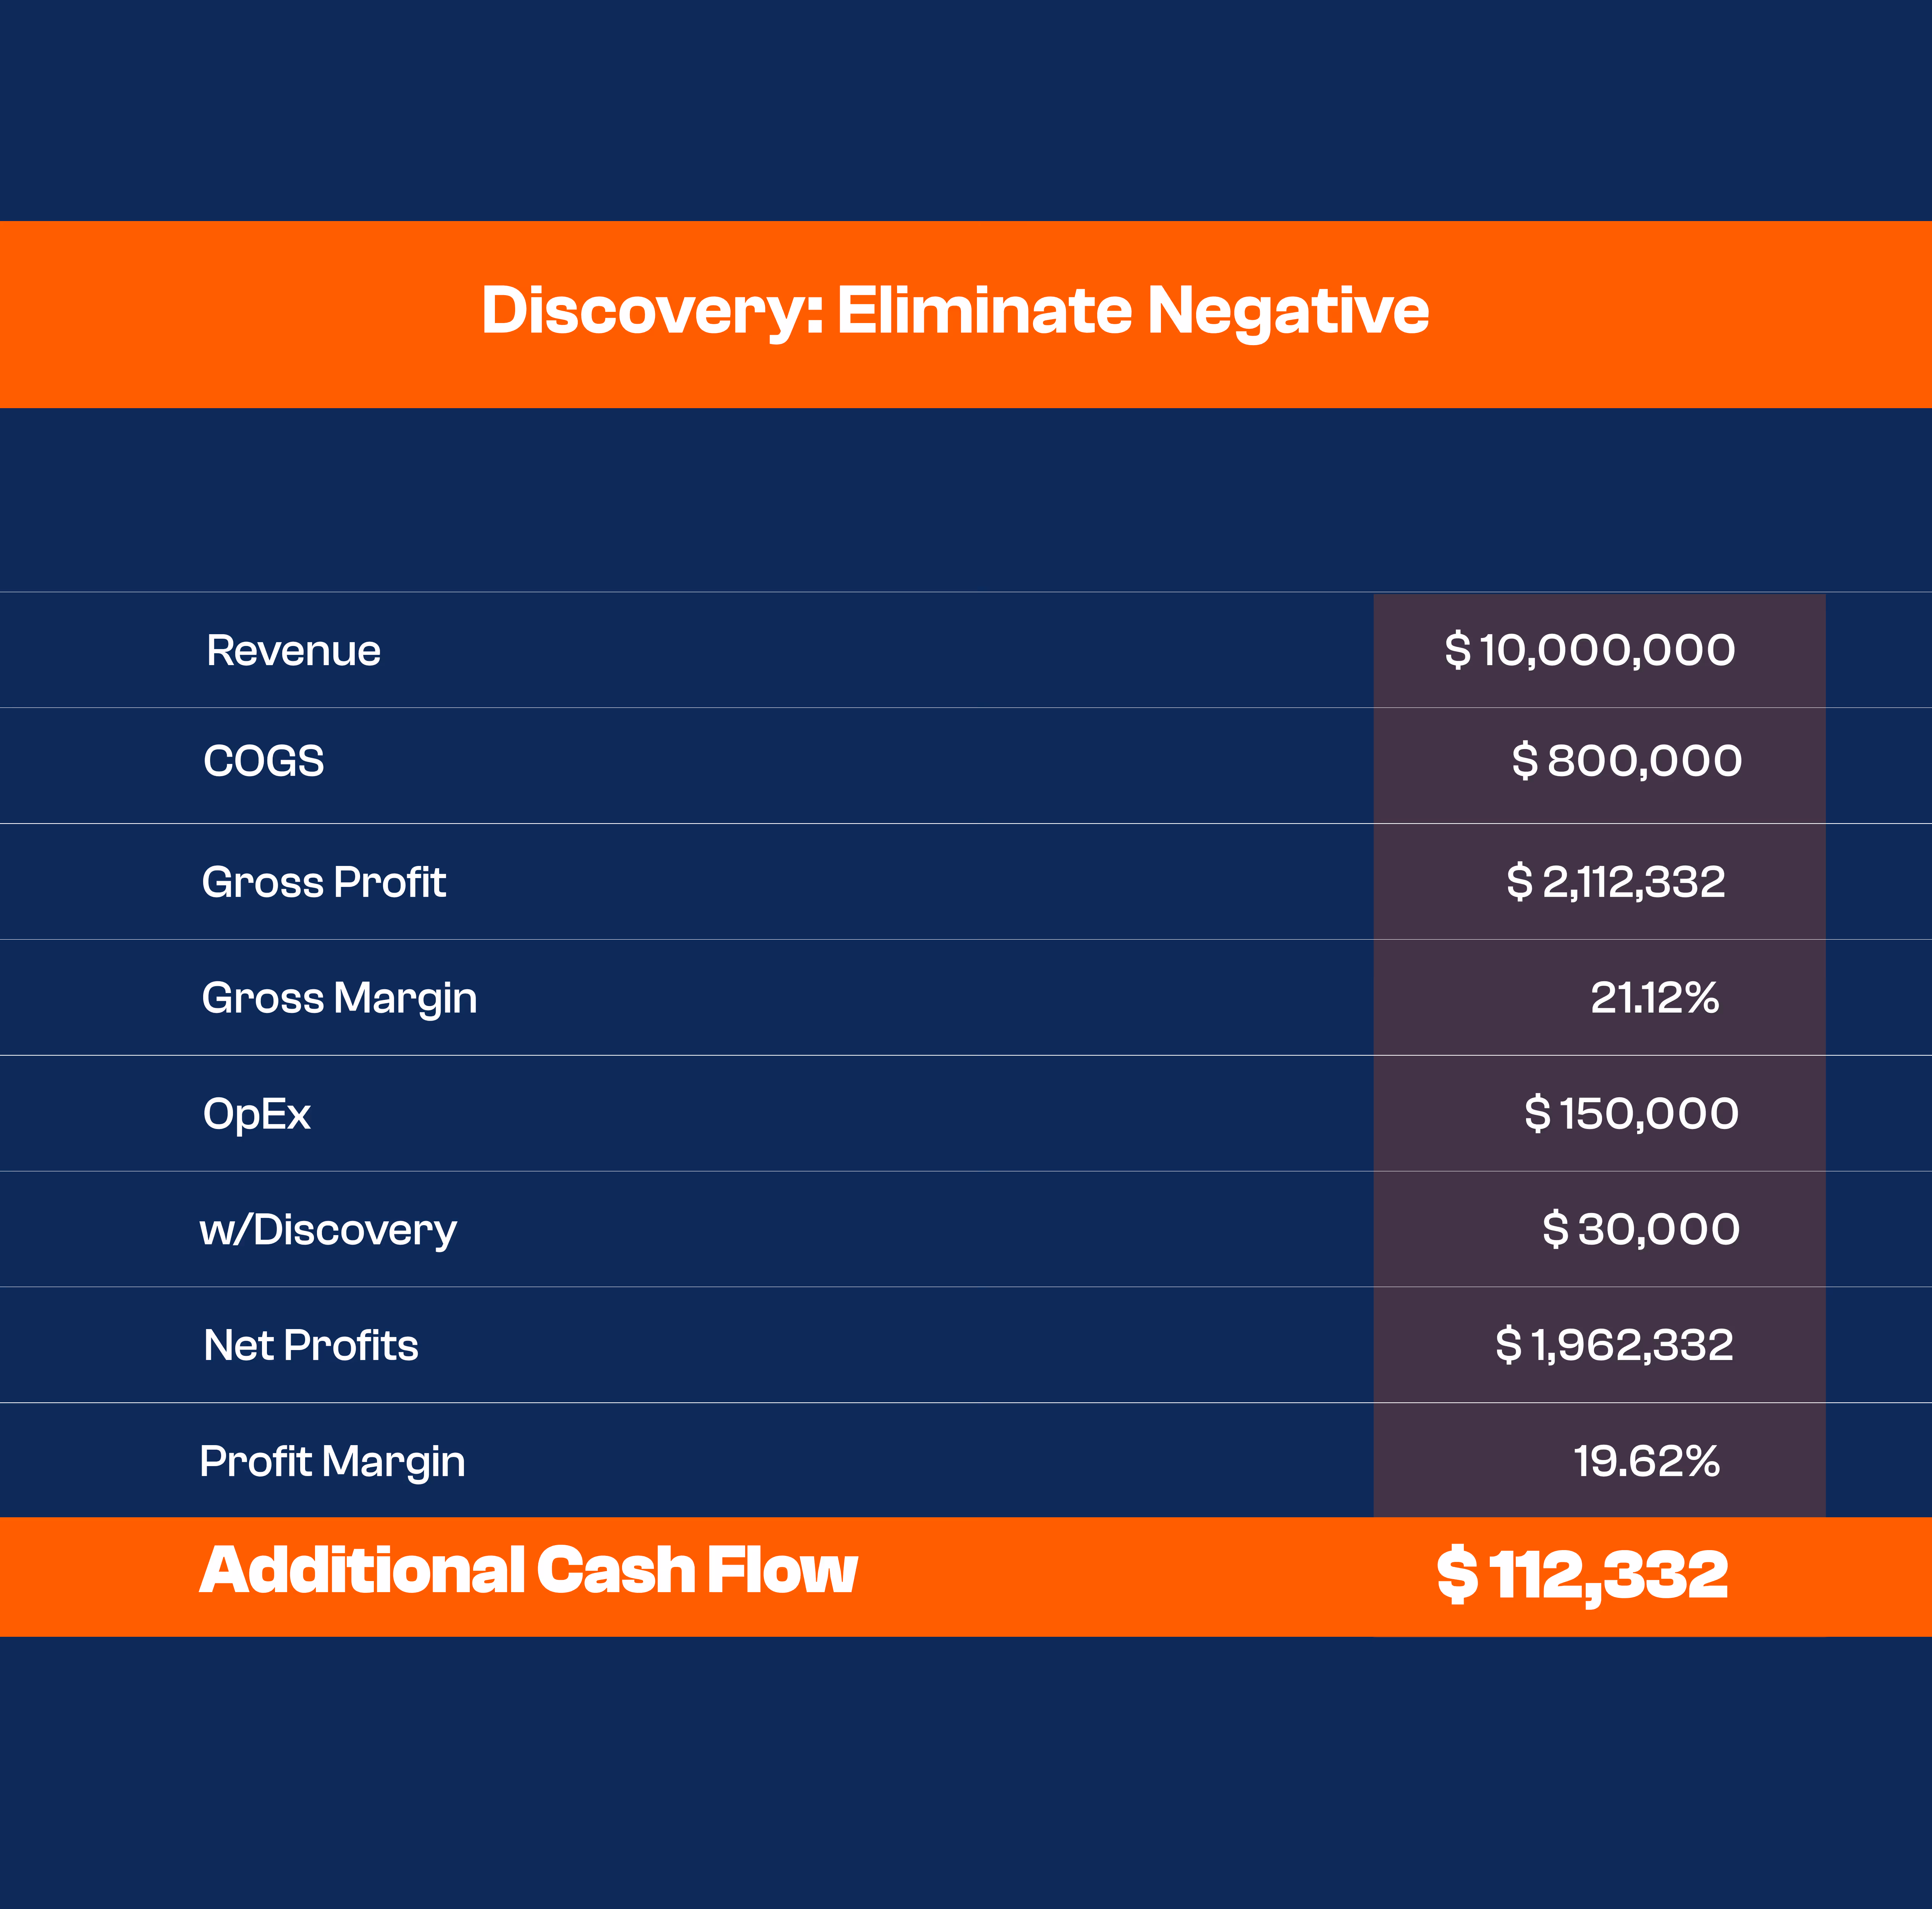
The impact increases with a larger portfolio. A brokerage with $10 million annual revenue could see even more efficiency. By understanding simply eliminating unprofitable locations, a brokerage could see a 19.62% increase in Net Profit Margin. By eliminating locations with <20% gross margin, a brokerage could see an additional ~$700k for the year.

‍

A snapshot of the $10M revenue Average Discovery Revenue Customer’s Cash Flow impact by eliminating unprofitable locations

‍

A snapshot of the $10M revenue Average Discovery Revenue Customer’s Cash Flow impact by eliminating <20% gross margin locations

‍

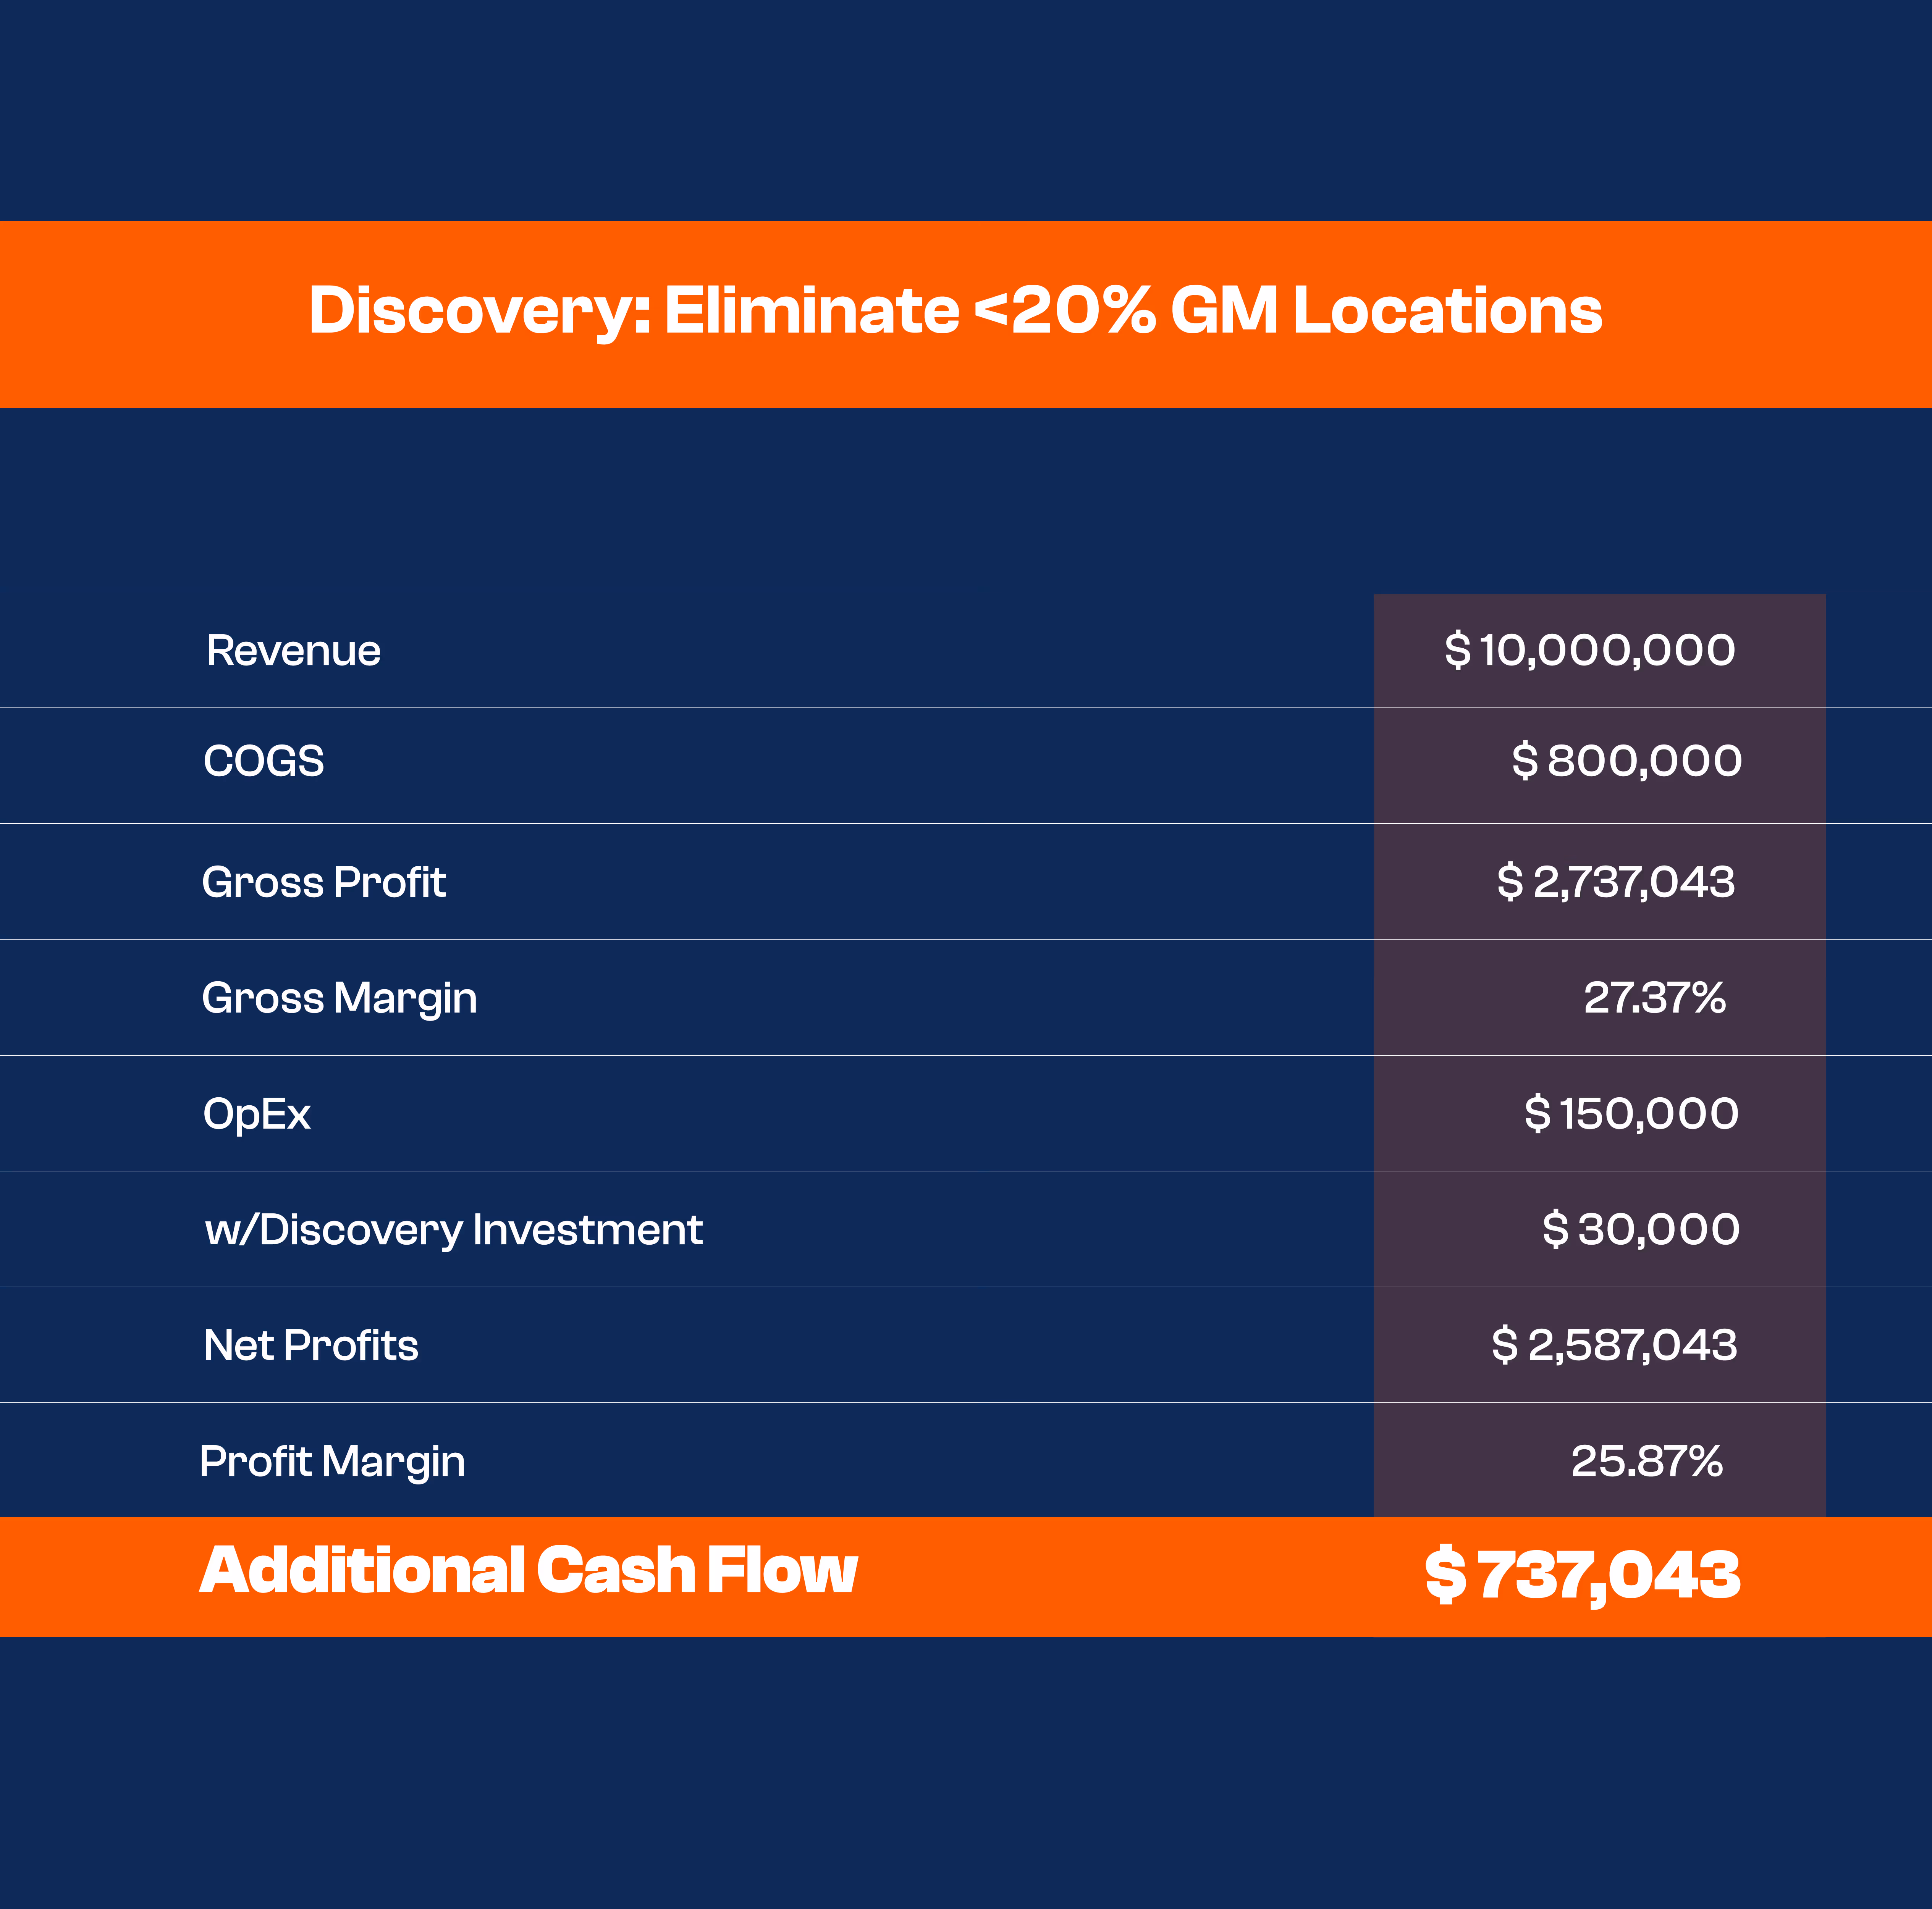
What would your brokerage do with an additional $73k next year? How about $737,000? With Discovery’s efficient data extraction and reports, you could have those funds to reinvest that in the business or give your team a raise.  

Leverage Your Customer Data

With Discovery’s Gross Margin Report and other data features, our brokerage customers truly understand their customer profile. With one report–instantly generated with the click of a button–brokerage executives know which locations are thriving and which locations require improvement or elimination.

Do you want to understand your brokerage’s portfolio without complicated Excel spreadsheets? Learn how Discovery’s efficiency works for brokers in this software demo.

‍

Share this post
John Doe
CEO, DSQ Technology
Blog

More Case Studies

Discover insights from our successful projects.

Blog

Explore Our Case Studies

Discover insights from our successful projects.

Read Case Study

Transforming Waste Management Solutions

Learn how our innovative solutions are making an impact.
Published on
Date
Read Case Study

Transforming Waste Management Solutions

Learn how our innovative solutions are making an impact.
Published on
Date
Read Case Study
DSQ Discovery

"This is amazing!” | How Integrated Waste Services Spurred Growth, Increased Efficiency with DSQ Discovery

IWS transformed a week-long, three-person process into a one-day, one-person task with DSQ Discovery.
Published on
June 20, 2025
Read Case Study
DSQ Hauler

How A Northeast Hauler Ditched Google Sheets and got organized with Hauler Dumpster Rental Software

Hauler software helped one hauler organize inventory, dispatch quickly and bill properly
Published on
June 20, 2025
Read Case Study
DSQ Discovery

How Discovery Increases Brokerage Profitability by Up to 35%

Discovery’s Gross Margin Report eliminates manual calculations to identify unprofitable or low-margin locations to increase gross margins easily.
Published on
June 20, 2025

Get Started with DSQ Technology

Contact us today for more information or to schedule a personalized demo of our solutions.

Let's Talk TrashSign Up
a man in front of a waste management truck

Explore Our Solutions Today

Stay connected with us for the latest updates and insights in waste management.
LearnJoin
DSQ Discovery
Build A Faster TeamLoginHelp Center
Status:
status page badge
LegalPrivacy Policy
DSQ Pioneer
Find Trash SavingsLoginJoin Affiliate ProgramCalculatorBuy OnlineInstallation SetupLegal
DSQ Hauler
Get RollingLoginJoin Affiliate ProgramRoll Off SoftwareDumpster Rental SoftwareDispatching Software
Status:
status page badge
Legal
DSQ Tilt
Start Verifying HaulsHow Tilt HelpsReal-Time Alert SensorPricingCase Studies
DSQ Professional Services
Tell Us What You Need!Customer Data OnboardingMonitor & Sensor ManagementOpportunity AnalysisReporting & Invoice Auditing
Company Info
Our StoryExplore The DSQ BlogCareersFAQsContact Us
We care about your data. See our privacy policy.
Thank you! Your submission has been received!
Oops! Something went wrong while submitting the form.
© 2025 DSQ Technology, LLC. All rights reserved.